Campus Networking
Secure, resilient switching for enterprise campuses and office environments.
Explore Campus Networking Solutions →
Specialist power, cooling and infrastructure knowledge.
From design and deployment to maintenance and optimisation.
Responsive support from experienced infrastructure specialists.
Improve efficiency, reduce risk and extend infrastructure life.

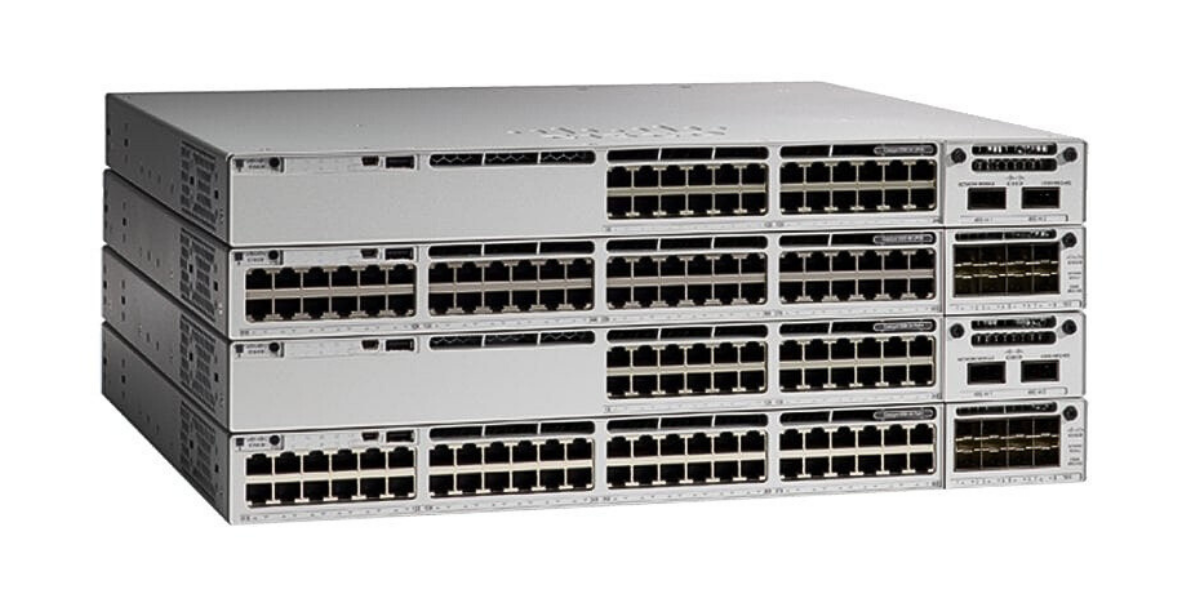
Secure, scalable and intelligent networking solutions for campus, branch, data centre and service provider environments.
Explore networking solutions →High-performance compute solutions designed to accelerate workloads from virtualisation to AI and HPC.
Explore compute solutions →

Genuine Cisco refurbished hardware with full warranty options, significant cost savings and a more sustainable approach to IT.
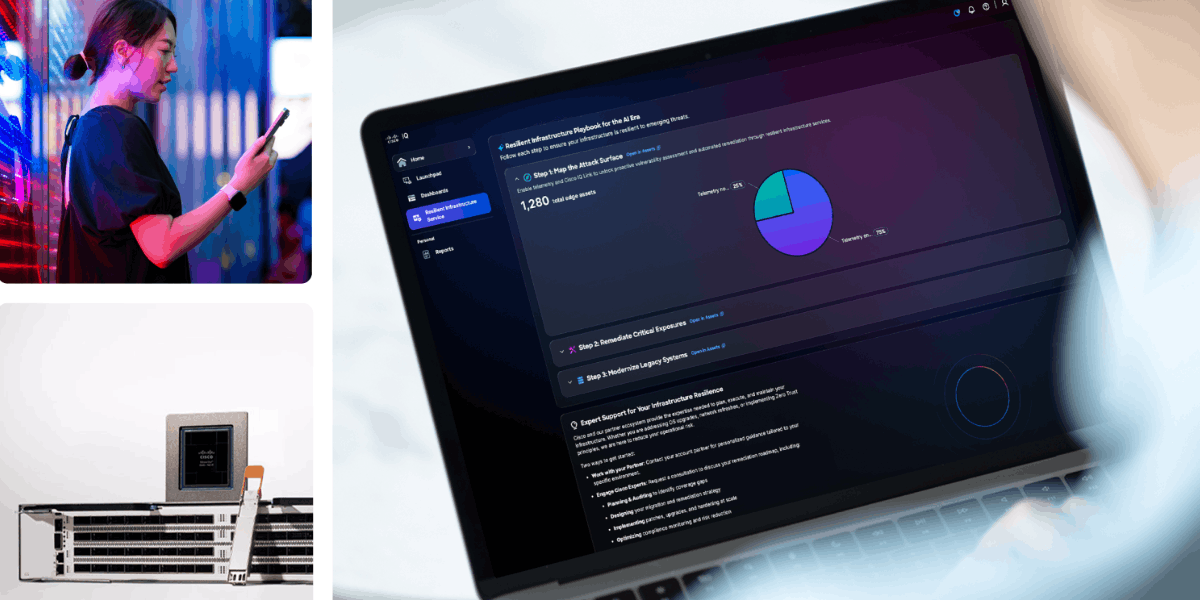
Expert technical support, software updates and advanced hardware replacement to help keep your Cisco infrastructure available and performing reliably.

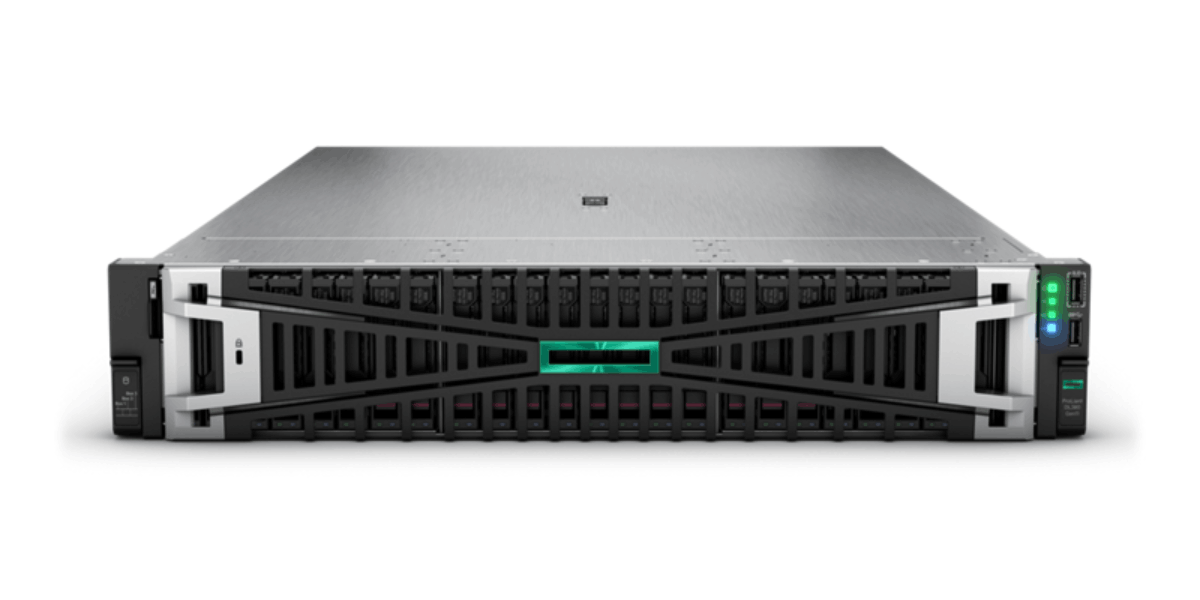
Industry-leading compute solutions built for performance, reliability and scalability.
Explore server solutions →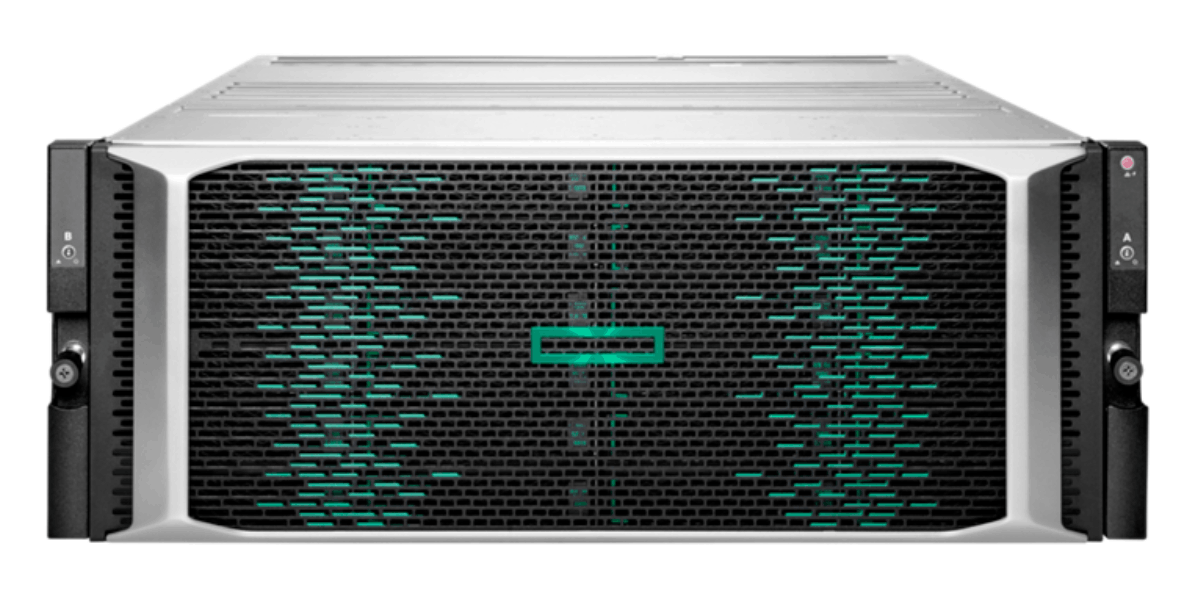
Intelligent storage solutions designed to protect, manage and accelerate your data.
Explore storage solutions →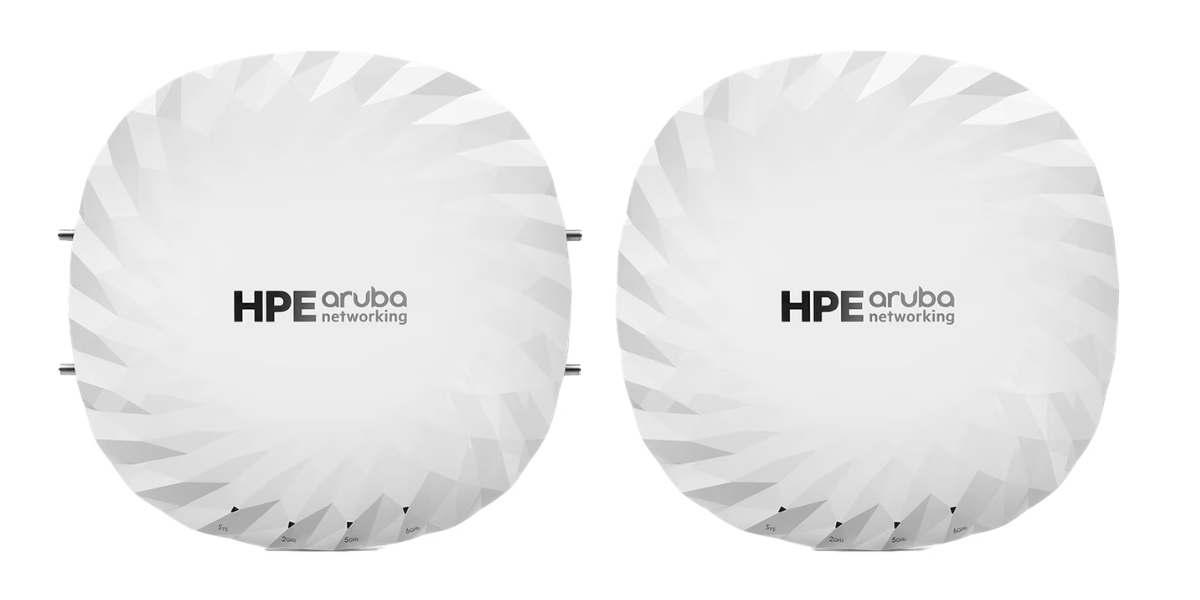
Secure, AI-powered networking solutions for campus, branch and data centre environments.
Explore Aruba solutions →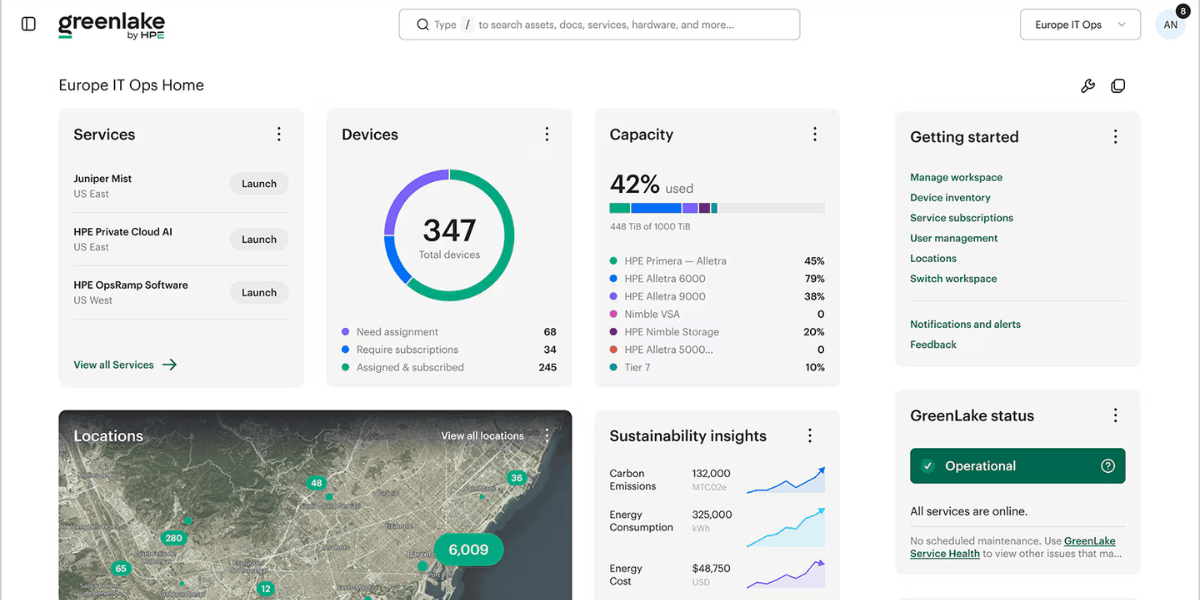
HPE GreenLake brings cloud-like flexibility to your infrastructure, helping you manage compute, storage, networking and hybrid cloud environments through a unified platform.

Expert technical support, proactive guidance and hardware assistance to help keep your HPE infrastructure available, supported and performing reliably.


AI-native network assurance and automation for wired, wireless, WAN and security environments, with proactive insights powered by Marvis.
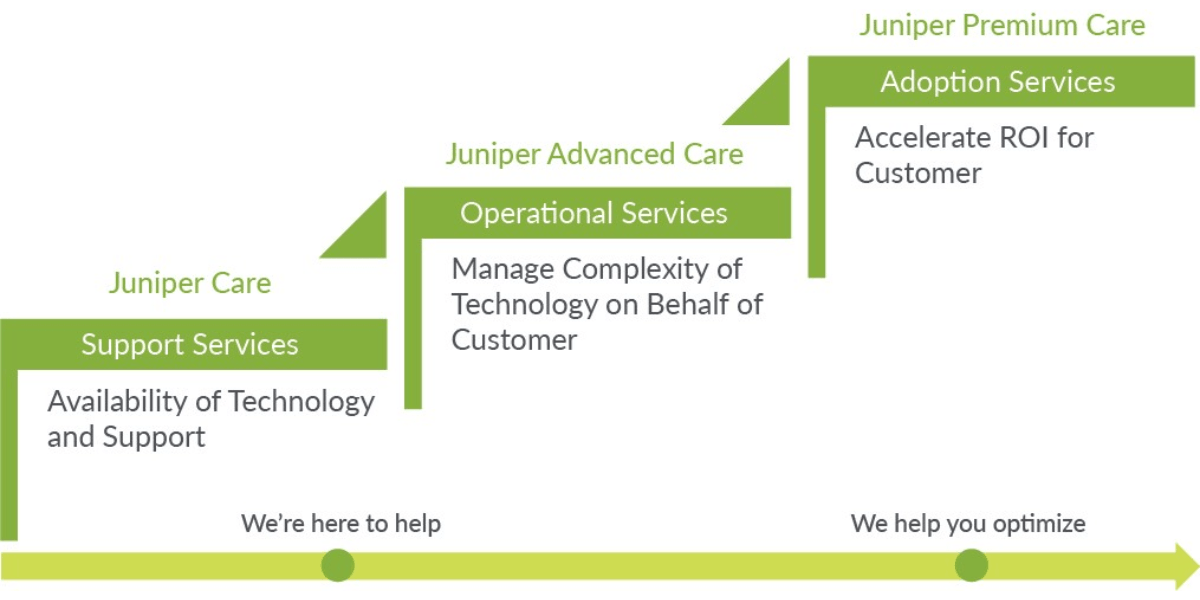
Technical support, software updates and hardware replacement services to help keep your Juniper network infrastructure available and performing reliably.
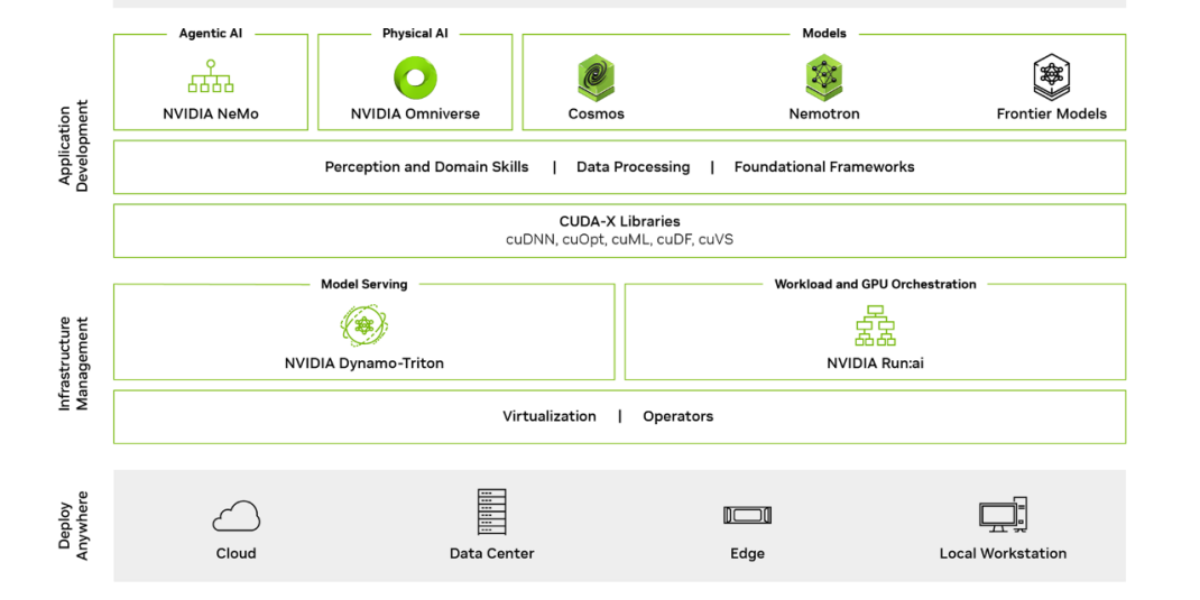
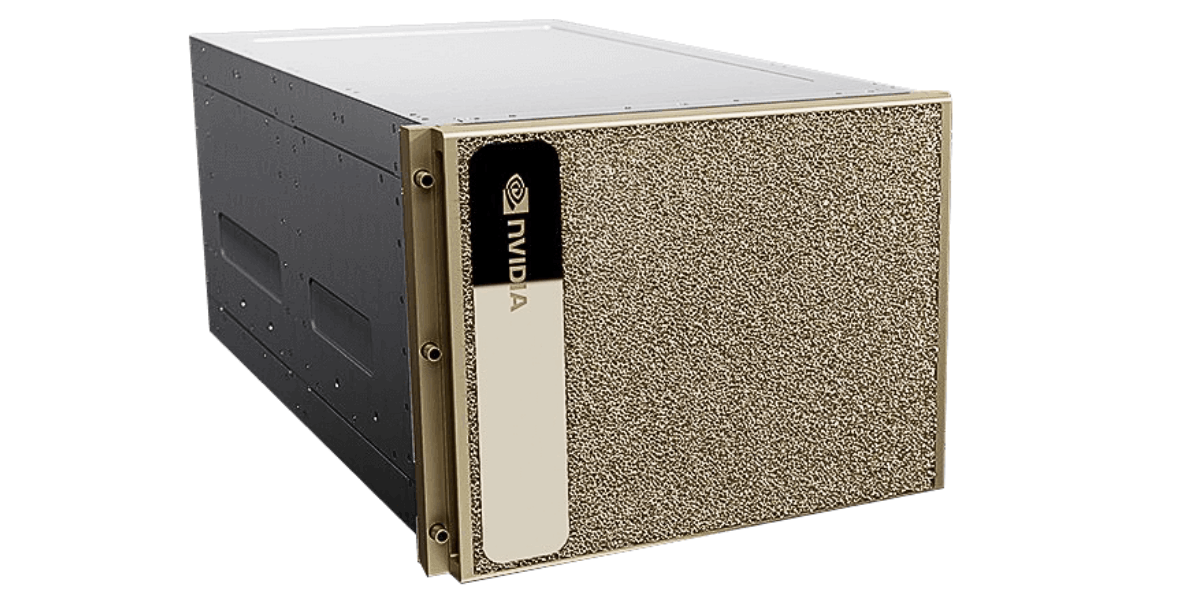
Enterprise AI software for developing, deploying and managing production AI workloads with NVIDIA frameworks, tools and optimised software.

Technical support, software updates and hardware assistance to help keep your NVIDIA AI, GPU and networking infrastructure available and supported.

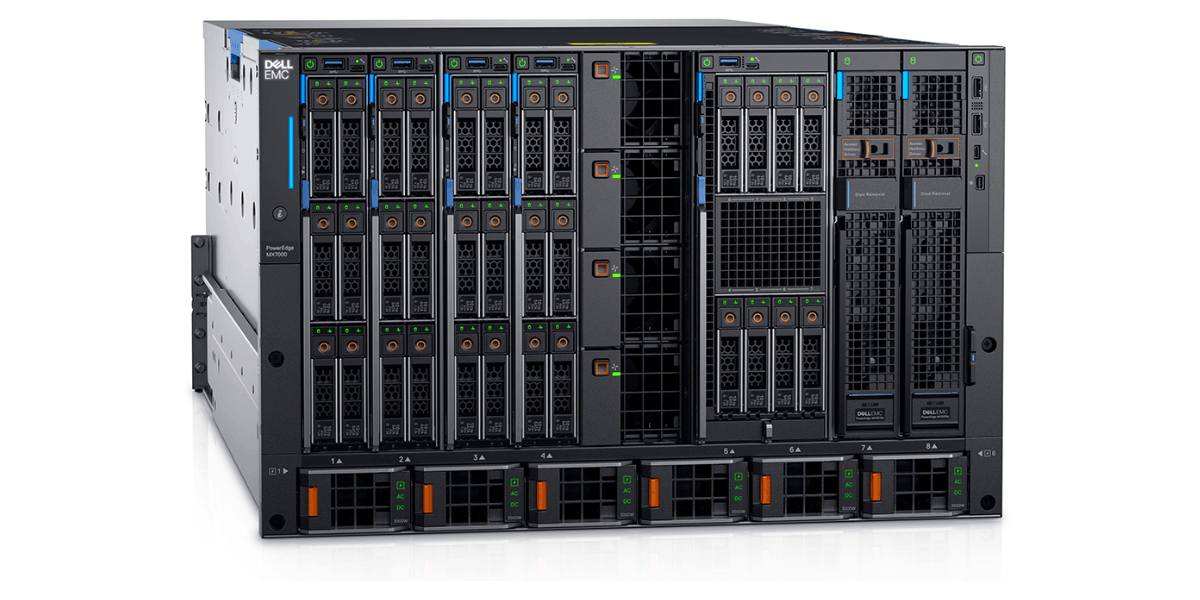
Dell PowerEdge servers and compute platforms built for virtualisation, business-critical applications, AI, HPC and modern data centre workloads.
Explore Dell compute →Dell storage and data protection platforms for primary storage, backup, recovery and scalable enterprise data management.
Explore Dell storage →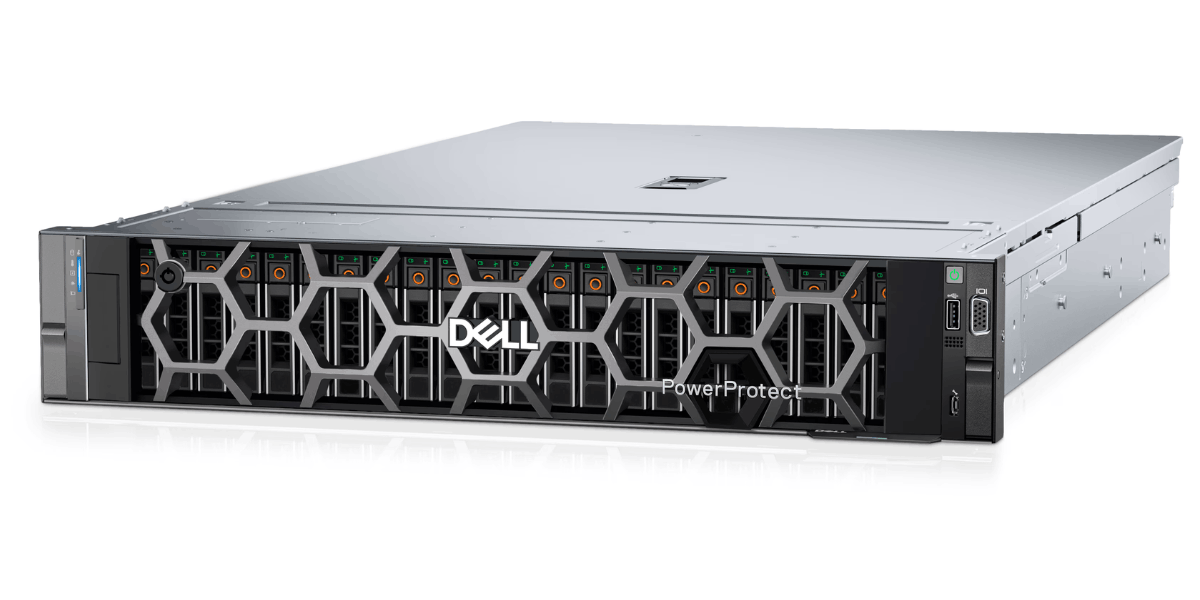
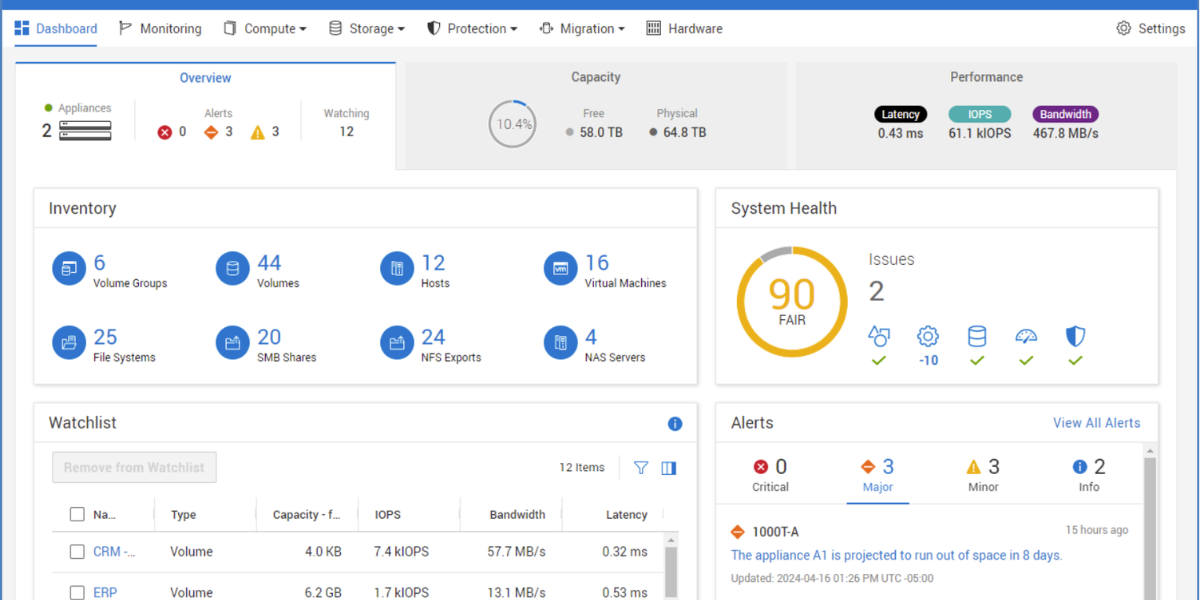
Flexible infrastructure and as-a-service solutions for deploying, managing and scaling compute, storage and cloud resources across your IT environment.

Technical support, proactive assistance and hardware expertise to help keep your Dell compute, storage and data centre infrastructure available and supported.
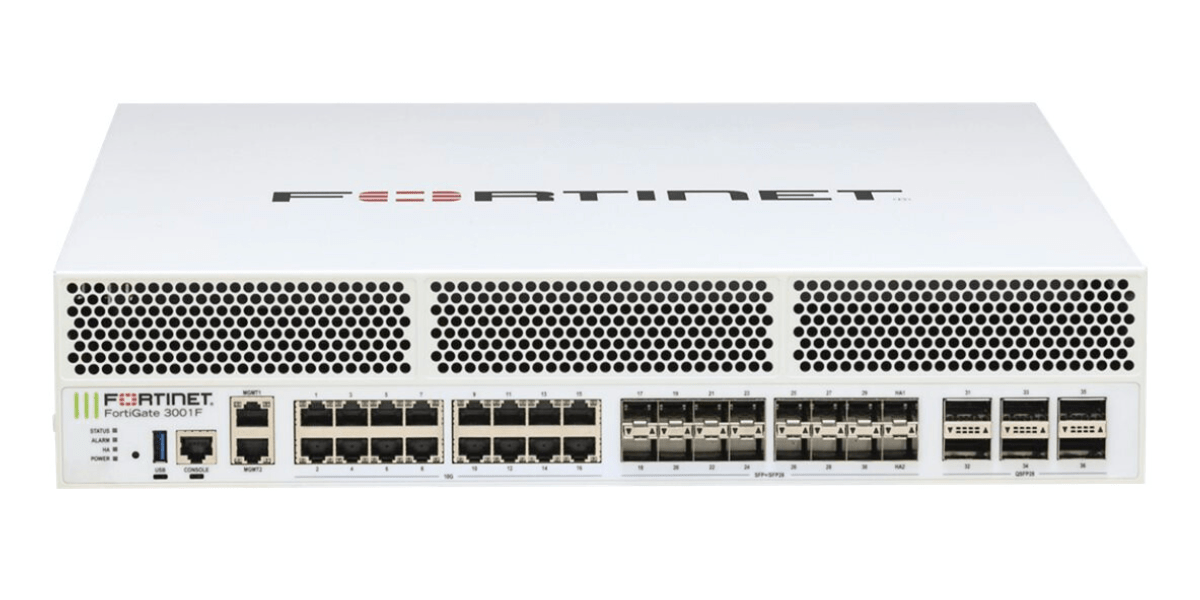
Protect your users, networks and data with integrated Fortinet security across branch, campus, data centre and cloud environments.
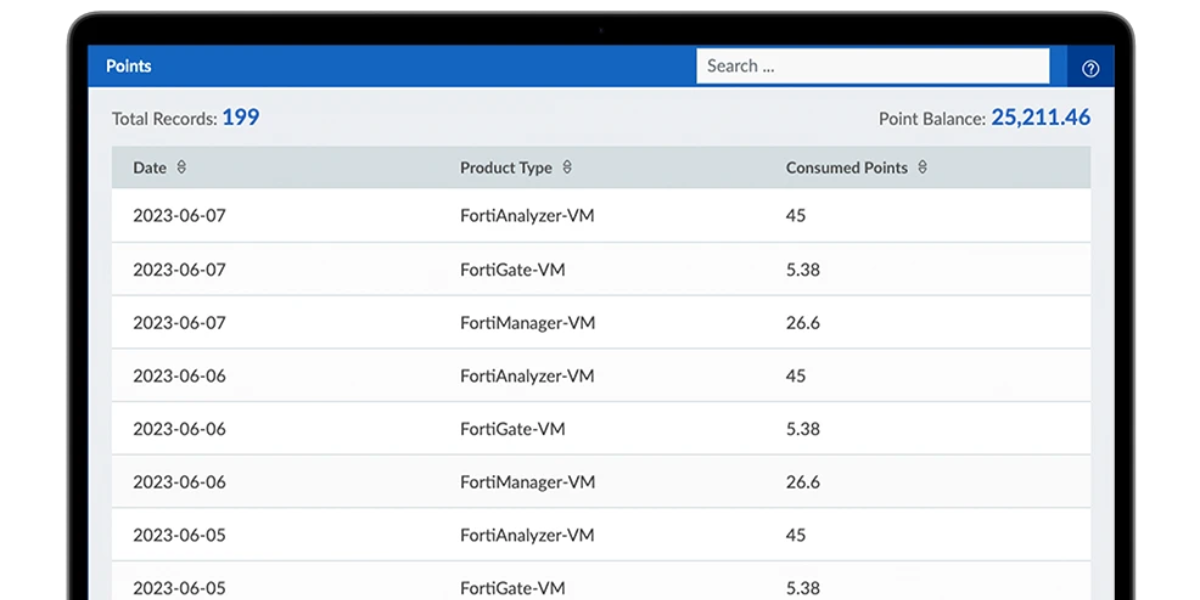
Flexible, points-based licensing that lets you scale Fortinet services around changing workloads, deployments and business requirements.
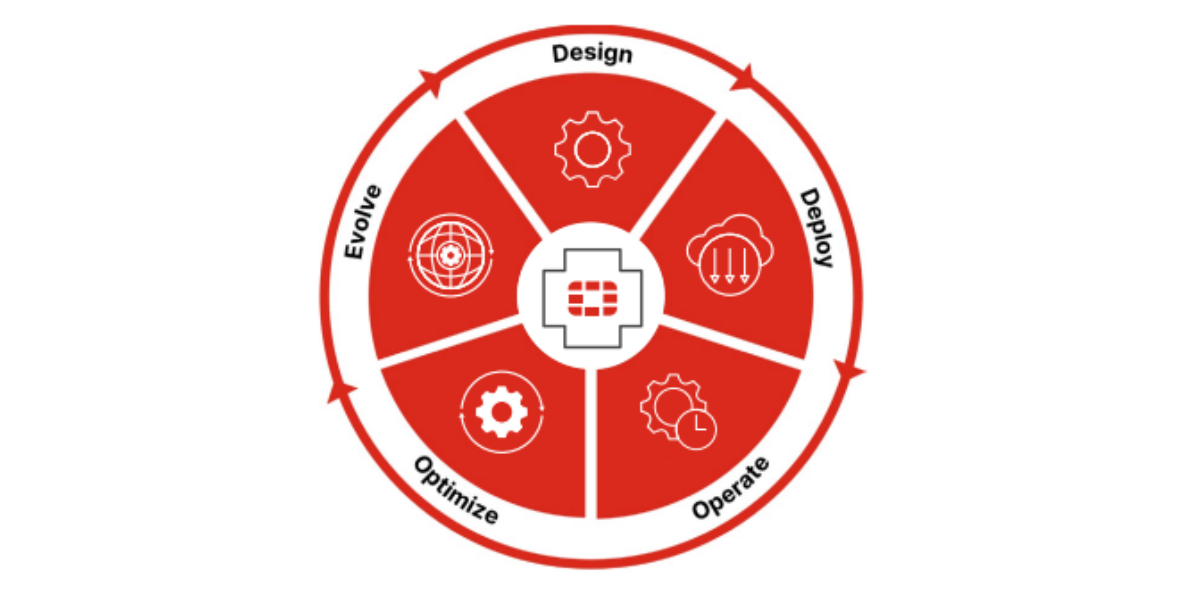
Fortinet technical support, firmware updates and hardware replacement services to help keep your security infrastructure protected and available.
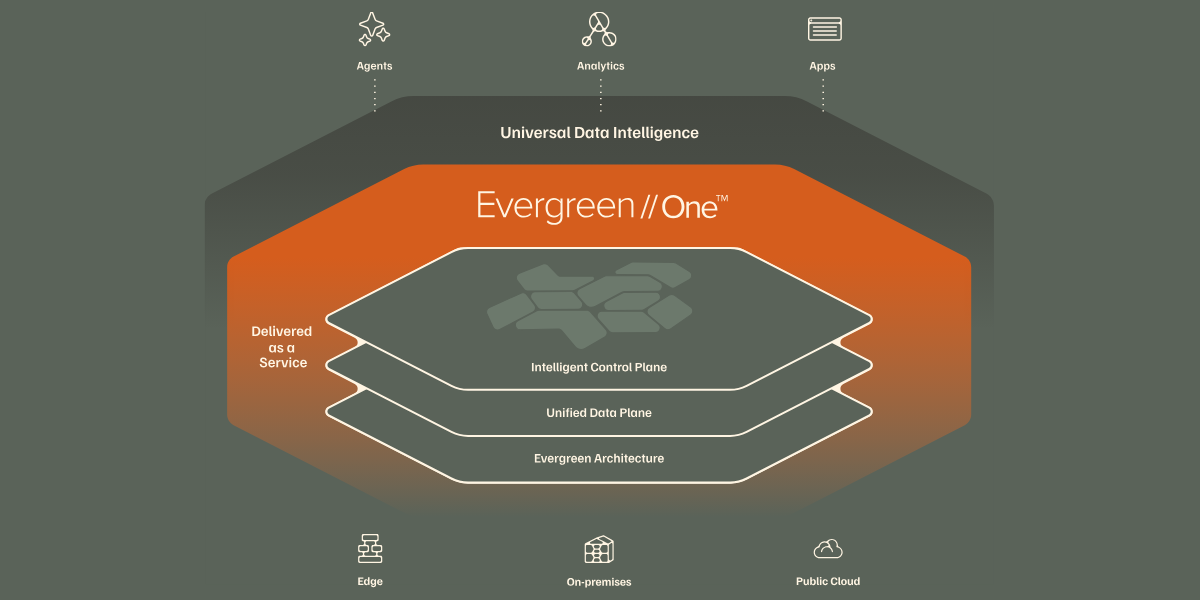
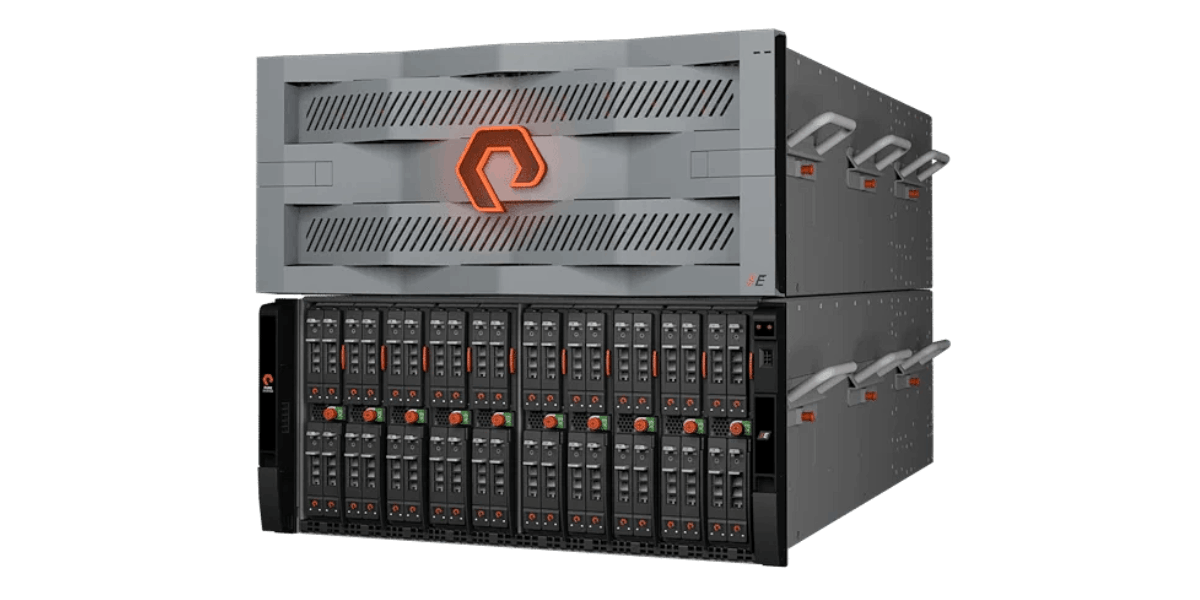
Modernise storage without disruptive refresh cycles, with continuous upgrades designed to extend infrastructure life and protect your investment.
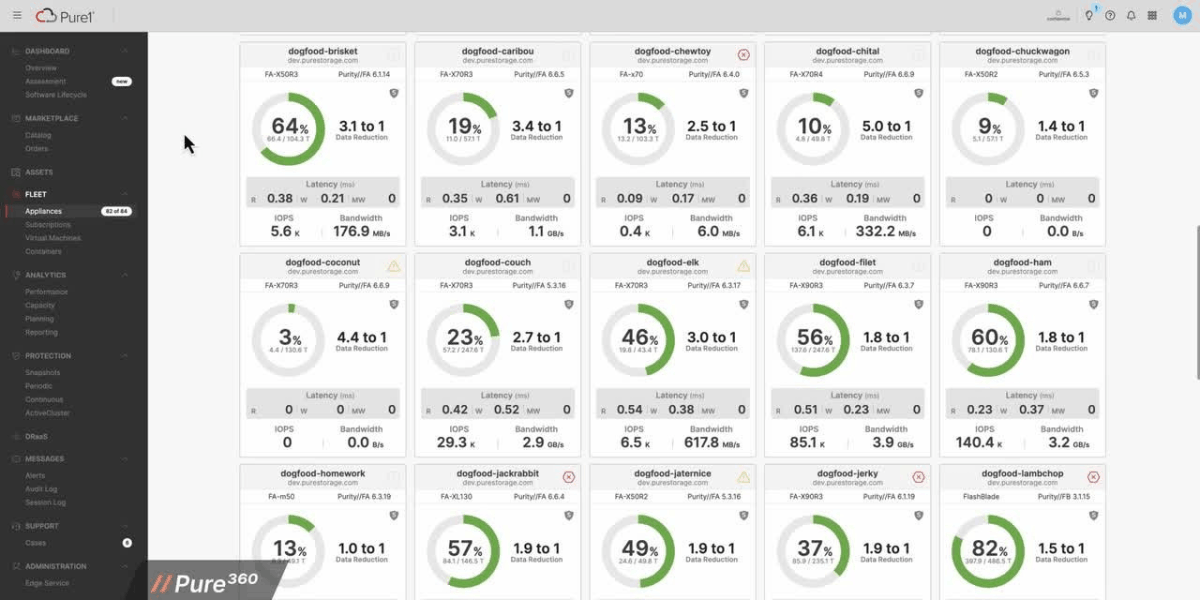
Technical support, software updates and lifecycle assistance to help keep your Pure Storage infrastructure available, secure and performing reliably.


Receive deployment-ready Supermicro servers with component installation, firmware updates, configuration and testing completed before delivery.
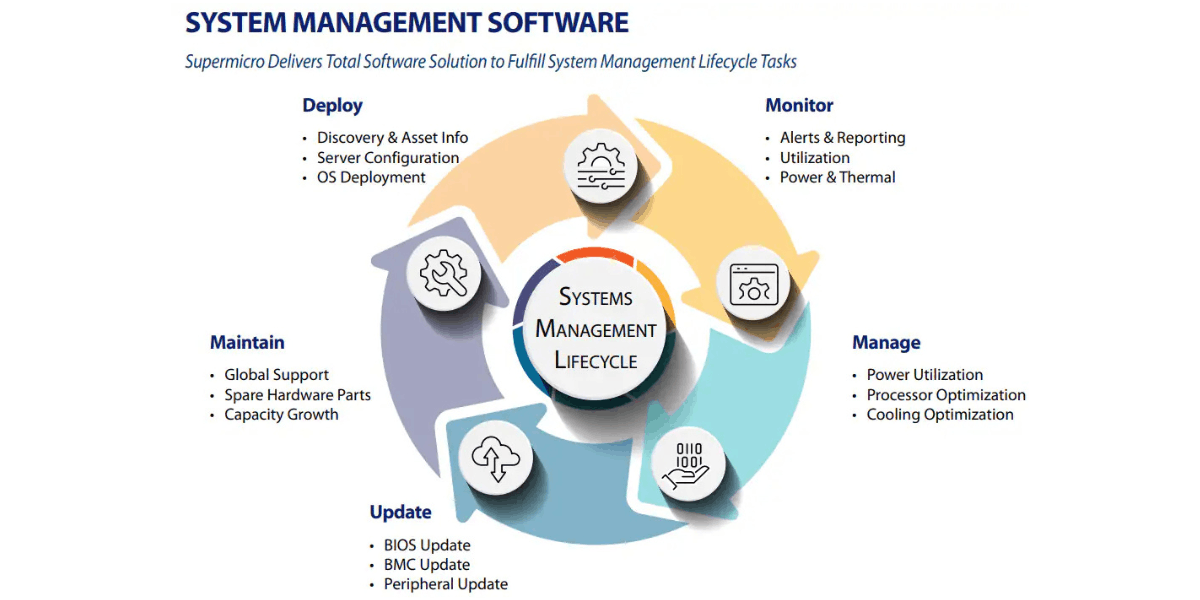
Technical guidance, hardware support and lifecycle assistance to help keep your Supermicro infrastructure available, reliable and fit for changing workloads.

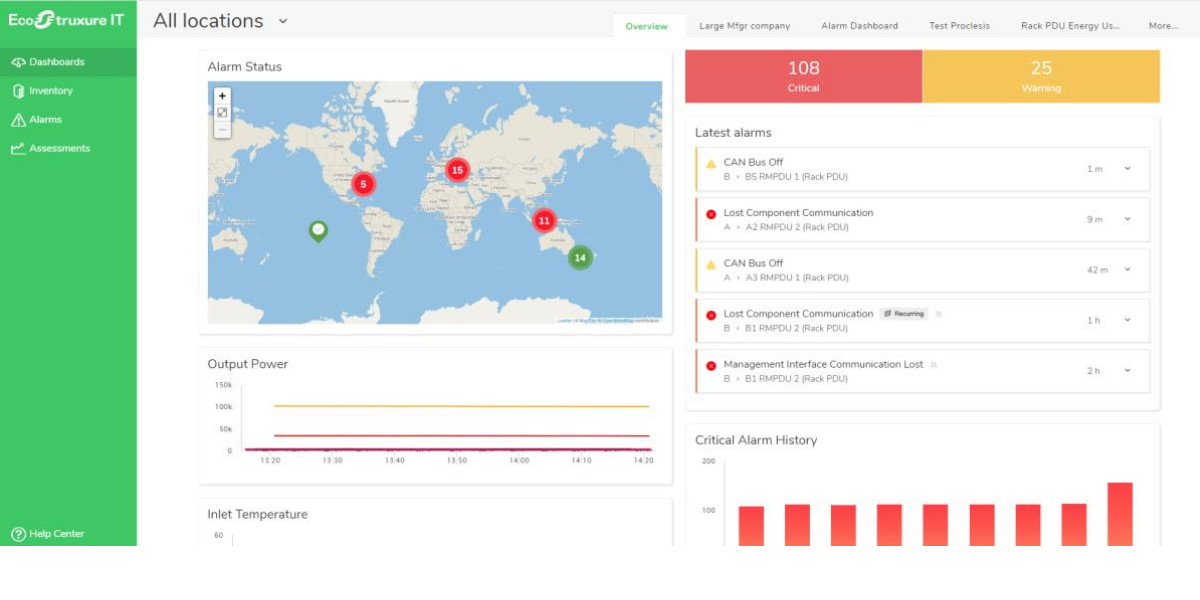
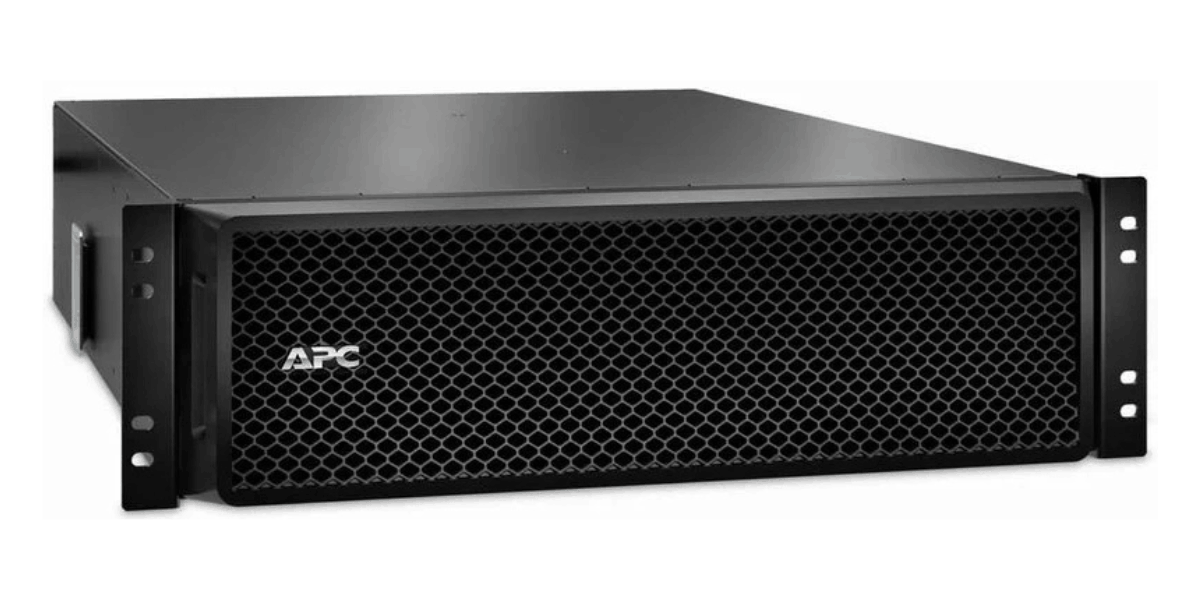
Monitor power, cooling and data centre infrastructure with centralised visibility, alerts and remote management across distributed IT environments.

Proactive support, maintenance and lifecycle services to help keep your APC UPS infrastructure reliable, supported and ready for critical workloads.
Specialist power, cooling and infrastructure knowledge.
From design and deployment to maintenance and optimisation.
Responsive support from experienced infrastructure specialists.
Improve efficiency, reduce risk and extend infrastructure life.
Secure, scalable and intelligent networking solutions for campus, branch, data centre and service provider environments.
Explore networking solutions →High-performance compute solutions designed to accelerate workloads from virtualisation to AI and HPC.
Explore compute solutions →
Genuine Cisco refurbished hardware with full warranty options, significant cost savings and a more sustainable approach to IT.
Expert technical support, software updates and advanced hardware replacement to help keep your Cisco infrastructure available and performing reliably.
Industry-leading compute solutions built for performance, reliability and scalability.
Explore server solutions →
Intelligent storage solutions designed to protect, manage and accelerate your data.
Explore storage solutions →
Secure, AI-powered networking solutions for campus, branch and data centre environments.
Explore Aruba solutions →
HPE GreenLake brings cloud-like flexibility to your infrastructure, helping you manage compute, storage, networking and hybrid cloud environments through a unified platform.
Expert technical support, proactive guidance and hardware assistance to help keep your HPE infrastructure available, supported and performing reliably.
AI-native network assurance and automation for wired, wireless, WAN and security environments, with proactive insights powered by Marvis.
Technical support, software updates and hardware replacement services to help keep your Juniper network infrastructure available and performing reliably.
Enterprise AI software for developing, deploying and managing production AI workloads with NVIDIA frameworks, tools and optimised software.
Technical support, software updates and hardware assistance to help keep your NVIDIA AI, GPU and networking infrastructure available and supported.
Dell PowerEdge servers and compute platforms built for virtualisation, business-critical applications, AI, HPC and modern data centre workloads.
Explore Dell compute →Dell storage and data protection platforms for primary storage, backup, recovery and scalable enterprise data management.
Explore Dell storage →
Flexible infrastructure and as-a-service solutions for deploying, managing and scaling compute, storage and cloud resources across your IT environment.
Technical support, proactive assistance and hardware expertise to help keep your Dell compute, storage and data centre infrastructure available and supported.
Protect your users, networks and data with integrated Fortinet security across branch, campus, data centre and cloud environments.
Flexible, points-based licensing that lets you scale Fortinet services around changing workloads, deployments and business requirements.
Fortinet technical support, firmware updates and hardware replacement services to help keep your security infrastructure protected and available.
Modernise storage without disruptive refresh cycles, with continuous upgrades designed to extend infrastructure life and protect your investment.
Technical support, software updates and lifecycle assistance to help keep your Pure Storage infrastructure available, secure and performing reliably.
Receive deployment-ready Supermicro servers with component installation, firmware updates, configuration and testing completed before delivery.
Technical guidance, hardware support and lifecycle assistance to help keep your Supermicro infrastructure available, reliable and fit for changing workloads.
Monitor power, cooling and data centre infrastructure with centralised visibility, alerts and remote management across distributed IT environments.
Proactive support, maintenance and lifecycle services to help keep your APC UPS infrastructure reliable, supported and ready for critical workloads.
Each vendor approaches observability from a different operational viewpoint. The best fit depends on whether teams need network experience assurance, broad hybrid infrastructure monitoring, or end-to-end digital service visibility.
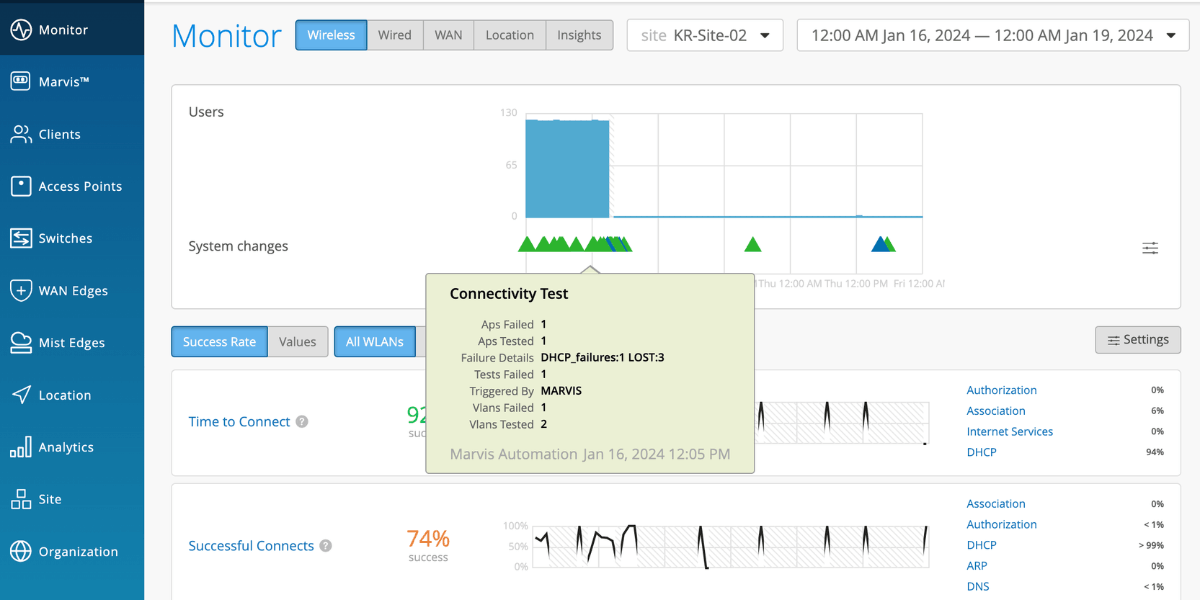
Best for: Mist-managed environments where network teams want faster troubleshooting through natural-language queries and AI-led actions, without depending on manual dashboard triage.
Why this vendor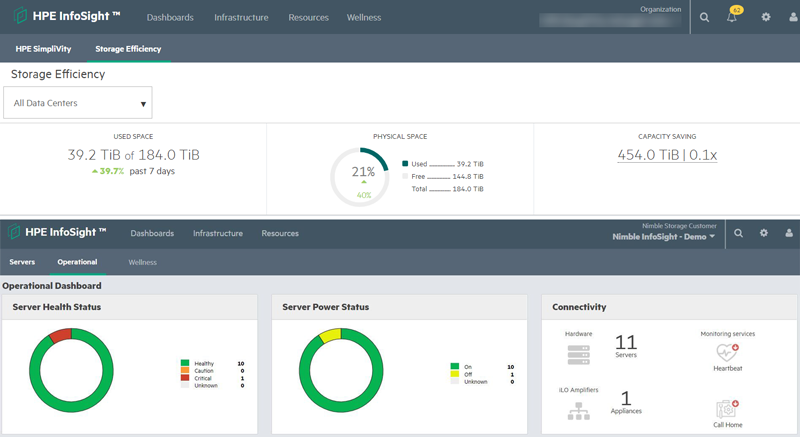

Best for: HPE-led hybrid estates that need predictive infrastructure intelligence alongside broader multi-vendor monitoring, event reduction, and service mapping across operational domains.
Why this vendor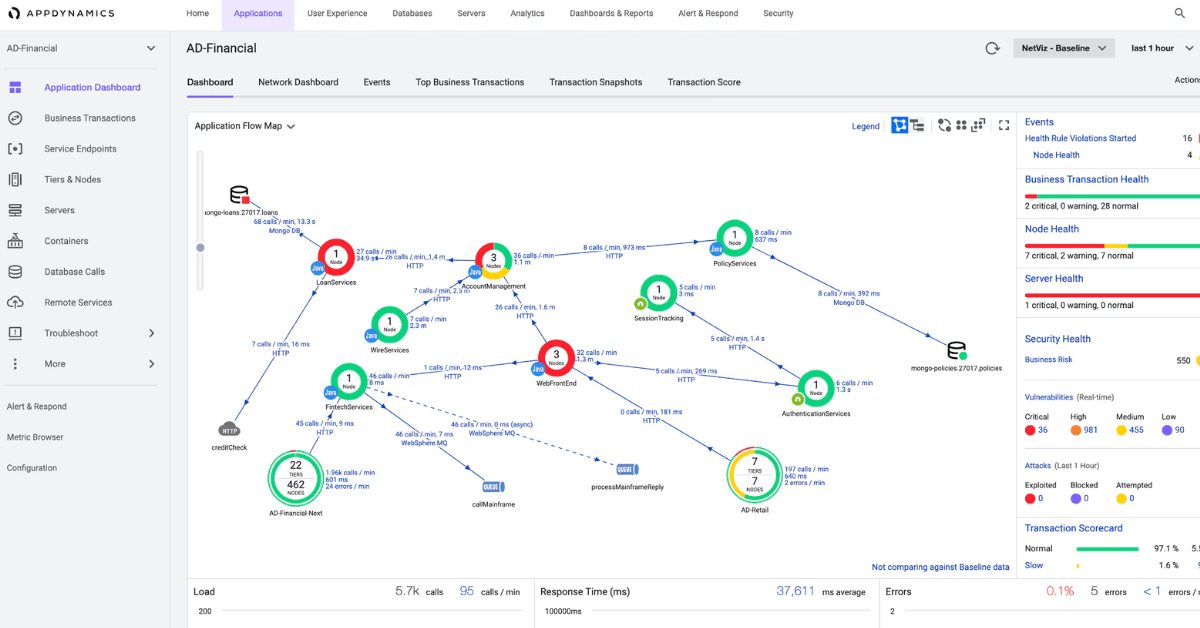

Best for: Digital services that must separate application-code faults from internet, cloud, SaaS, or network-path issues before escalation wastes engineering time.
Why this vendor